

Click edit button to change this text. Lorem ipsum dolor sit amet, consectetur adipiscing elit. Ut elit tellus, luctus nec ullamcorper mattis, pulvinar dapibus leo.

Mila Kunit
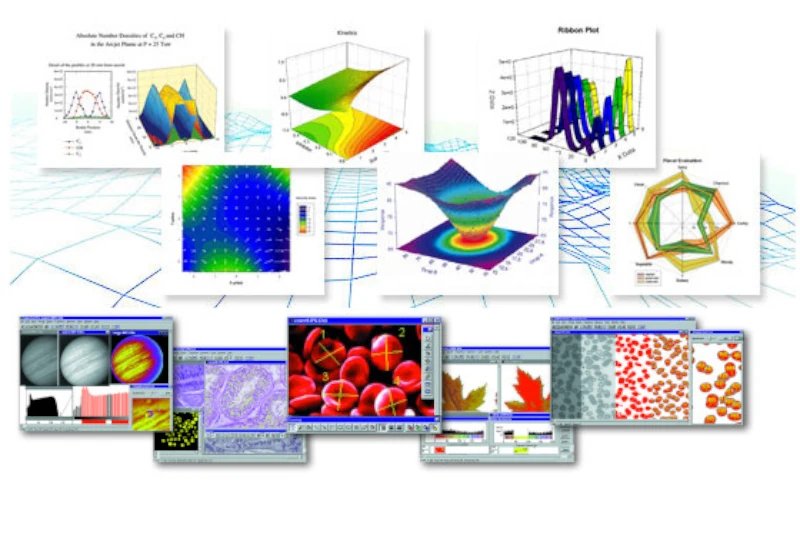
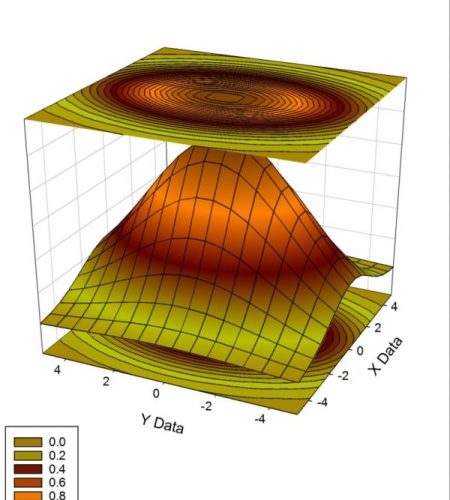
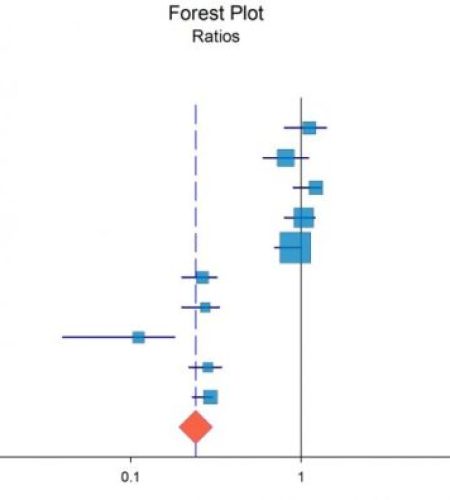
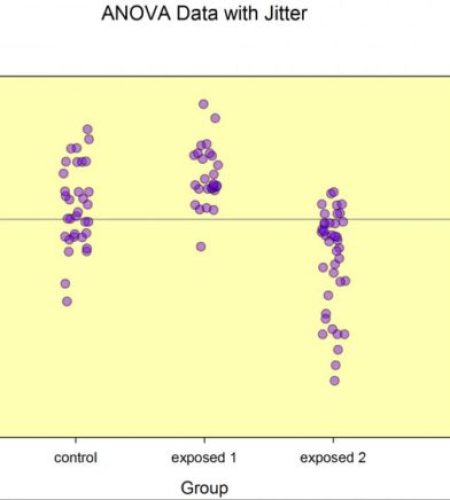
SigmaPlot v16
Products designed specifically to meet the needs of scientists, researchers and engineers